Warehouse Layout Optimization
Sales & Inventory Analysis
The first step in producing an optimal warehouse layout and pick area design is analyzing past sales and inventory levels. This is the foundation in determining the current warehouse size requirements and the layout of the back stock and pick area. We also look at projected sales increases and net SKU additions for the next 10 years to determine future warehouse space requirements. This can provide invaluable assistance to determine if a future expansion or new warehouse is required. We will also look at expansion opportunities on your current property.
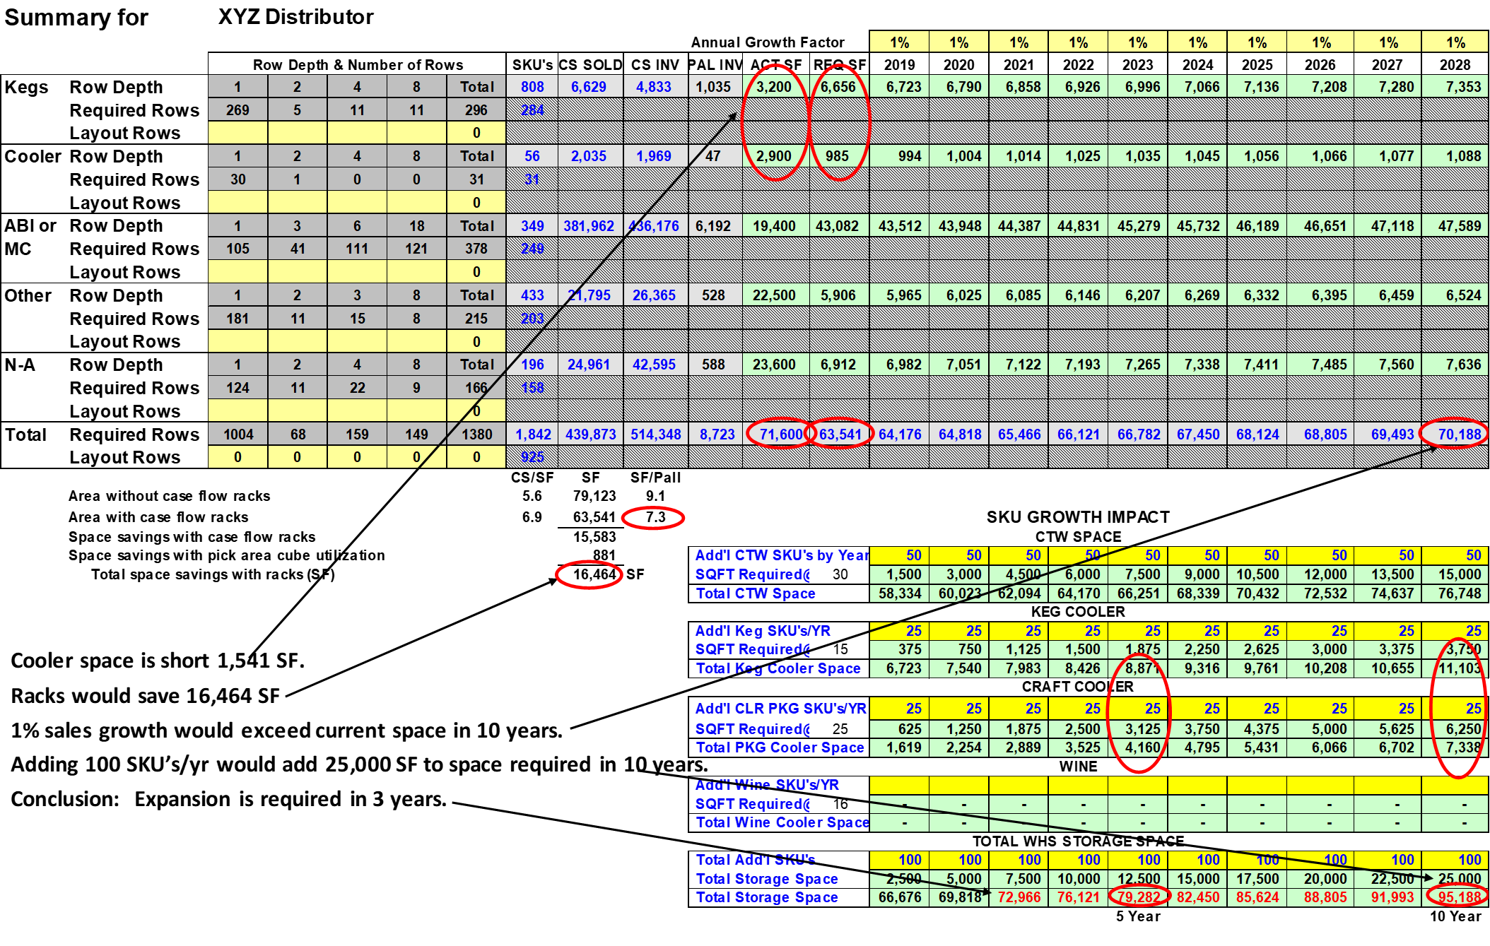
Next we determine the storage type for each SKU in the pick area such as row, rack or case flow. Once this is evaluated for each package type and summarized, it is time to develop the warehouse layout and pick area design.
Warehouse Layout & Pick Area Design
Warehouse storage capacity and worker productivity depend heavily on an efficient warehouse layout and pick area organization. You can often delay warehouse expansion by improving the current layout and maximizing cubic utilization. New beverage warehouses are being built with 32 feet or more clear height to allow for 4 high pallet storage in racking.
Pick area design is crucial to optimizing productivity. 70% of pick time is spent looking for products and travel time. Implementing a compact pick area and utilizing appropriate pallet and case flow racks can often increase cases picked per hour by more than 50%. With an engineered layout and automated wrappers, pick rates above 300 cases per hour are achievable.
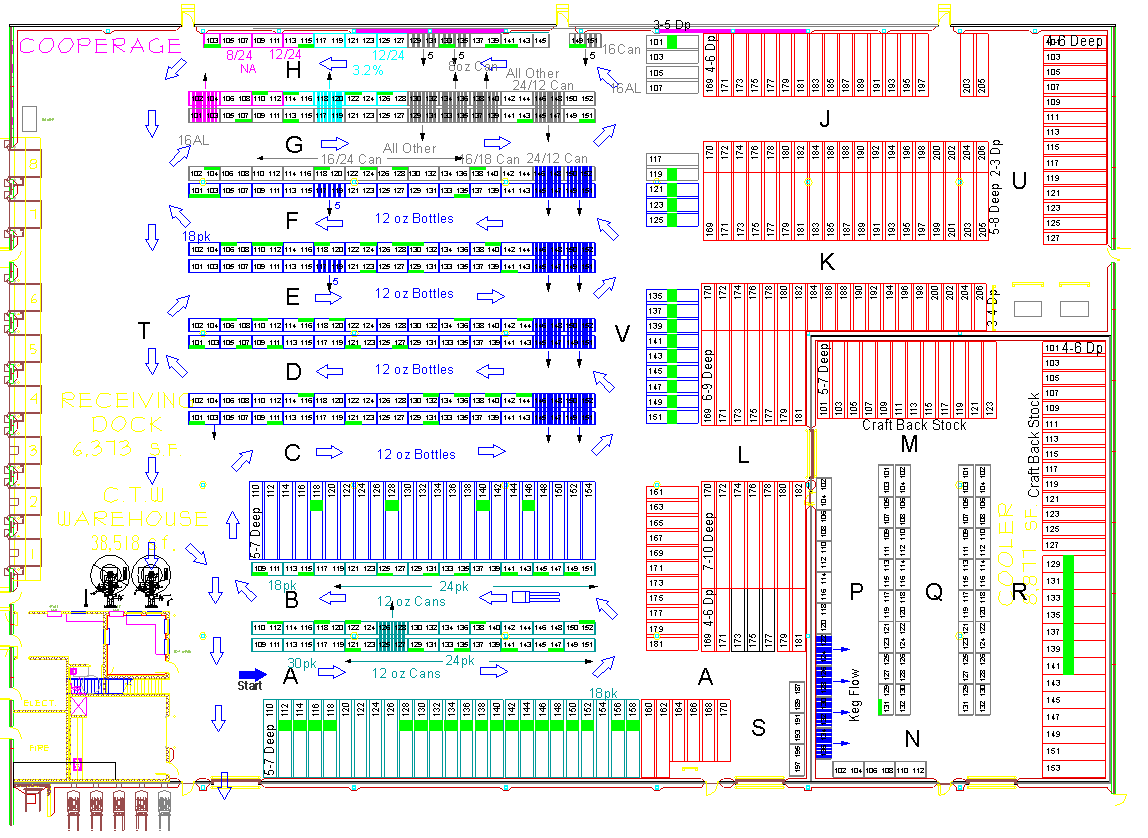
The following warehouse layouts are typical examples. The arrows indicate the pick path direction. Notice that storage locations are included in the layout.
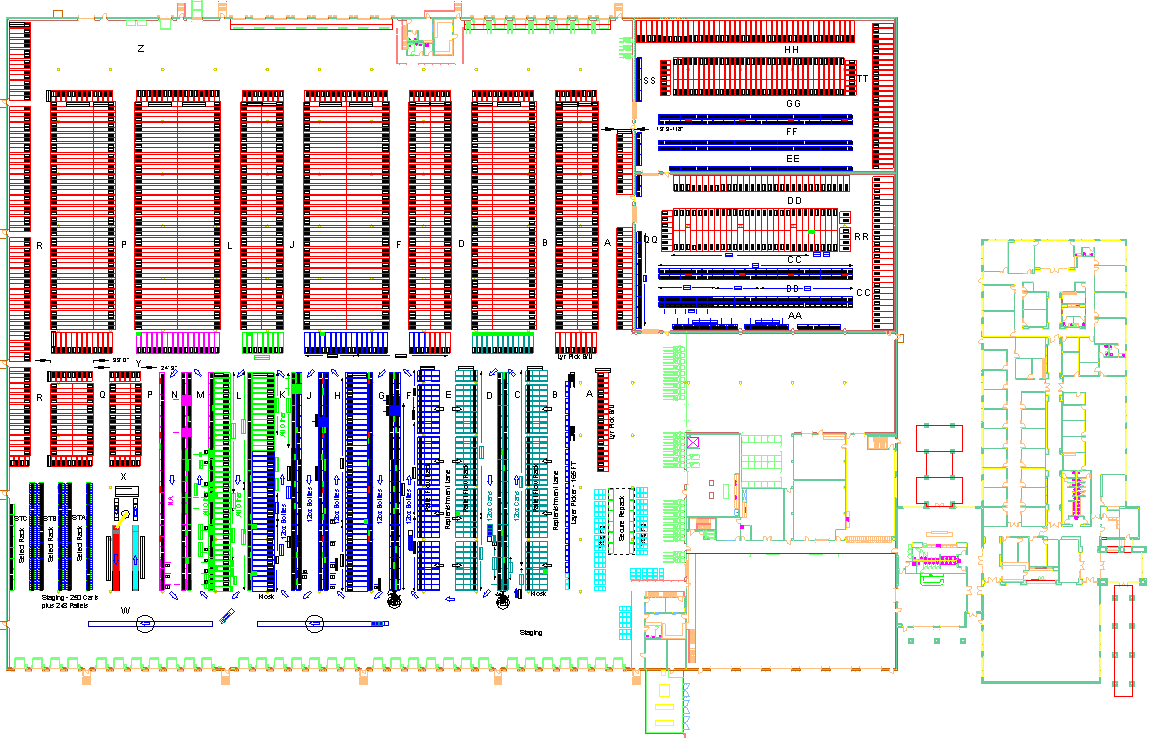
Product Slotting
There are several approaches to product slotting. We prefer slotting by package height in 1/4″ increments so that pallets are built in even layers for stability. Each package size is only encountered once on the pick path by intermixing high, medium and low volume along the pick path. Clients have input on package sequence and most prefer starting with 12 oz cans followed by 12 oz bottles with all other packages at the end.
We can also slot an alternative way with all the high volume at the start of the pick path, medium volume next and low volume case flow at the end. With the high volume products in one area, productivity can suffer because of traffic congestion and blocked aisles. Each package size is encountered 3 times instead of once which can have a negative effect on pallet stability.
Productivity Improvement
We have helped many distributors improve their productivity by several methods:
- Utilizing 102″ to 120″ walkie riders
- Implementing layer picking
- Automatic stretch wrapping
- Single/Double forklift attachments
Picking Equipment
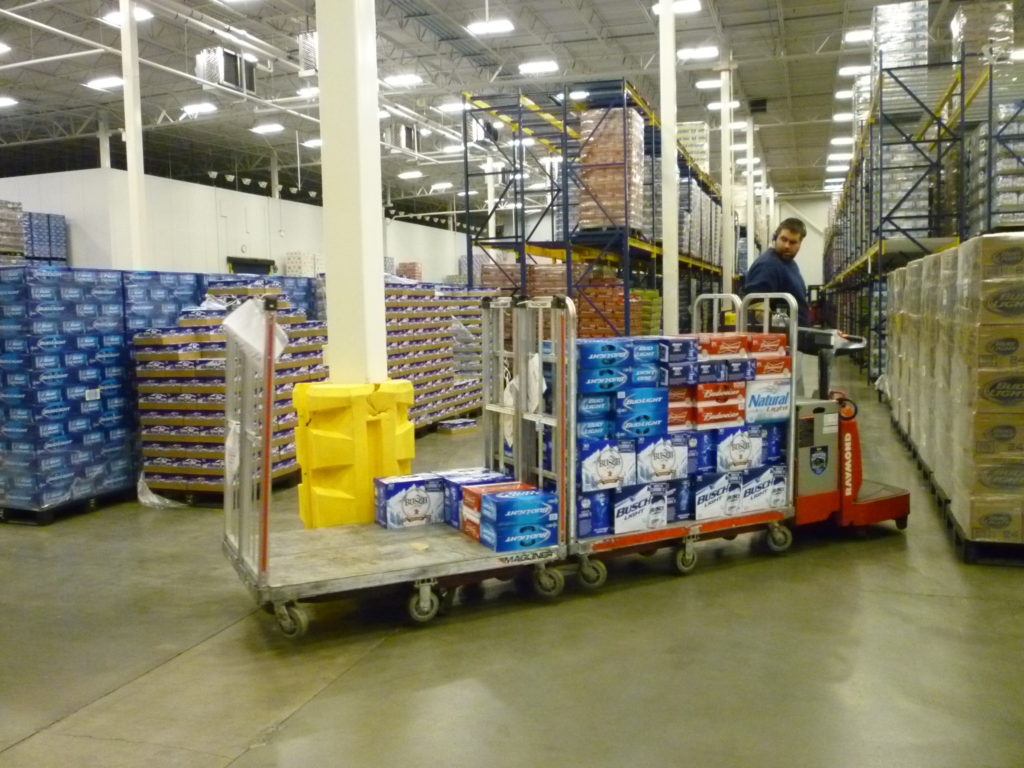
Another opportunity to increase output is using walkie riders instead of forklift trucks for picking. Many operations average 300 cases/hour and above after converting to walkie riders which can carry 2 GMA pallets or 3 AB/Miller pallets. This allows personnel to pick up to 3 orders at a time using voice picking.
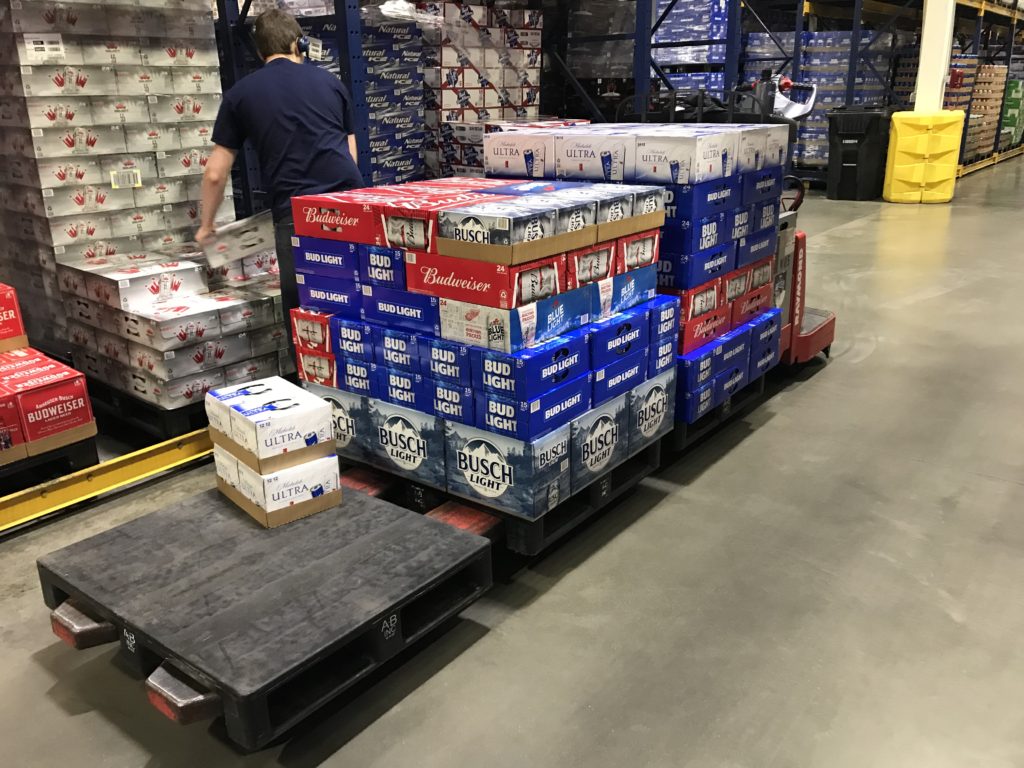
Some distributors are using 120″ walkie riders to pick 4 carts simultaneously or up to 4 small orders. This reduces the number of trips through the pick area which increases productivity.
Layer Picker
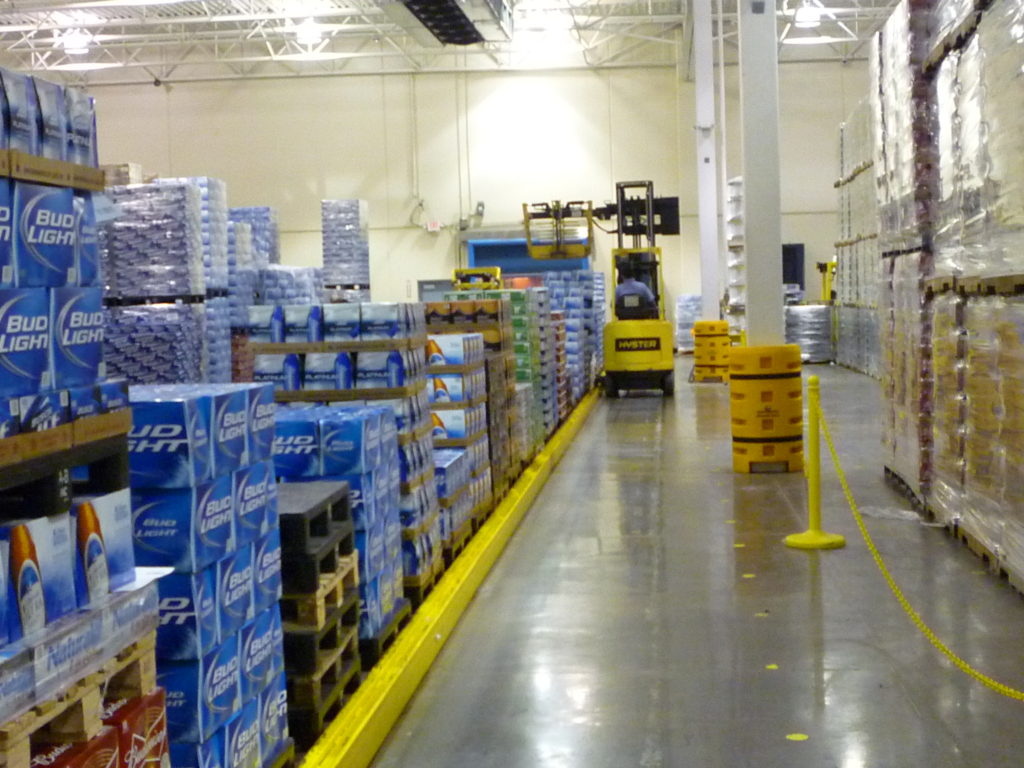
Layer picking is usually justifiable if there are 10 or more packages with the same size pallet that sell more than 5,000 cases per month. Most distributors have found that they can reach 1,500 cases per hour with a layer picker operator and part time helper after 4-6 months of on the job training. The cost for a 6,500 pound forklift, layer picker attachment and the guide rail is approximately $75,000 and usually the ROI is less than one year. We have distributors that are currently layer picking 12% to 42% of the total product shipped per day.
Automatic Stretch Wrappers
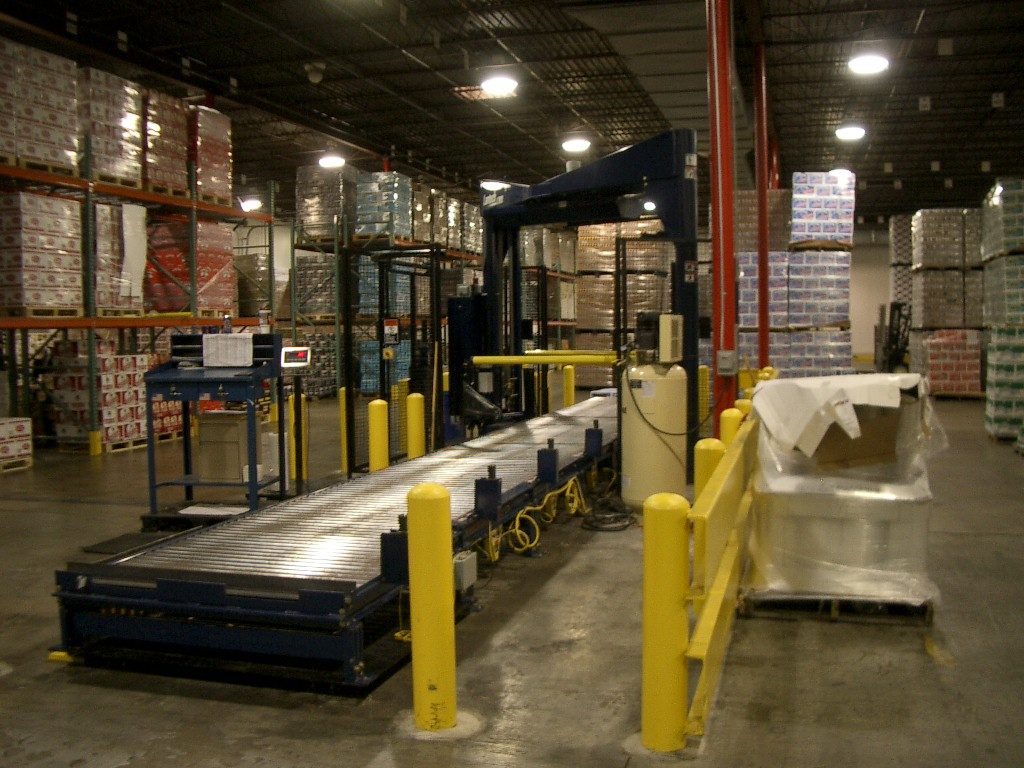
Wrapping pallets by hand can take up to 2 minutes of the picker’s time. Automatic stretch wrappers can free up the picker’s time to increase productivity and reduce stretch wrap costs by 50%. The wrappers can hold from 3 to more than 25 pallets.
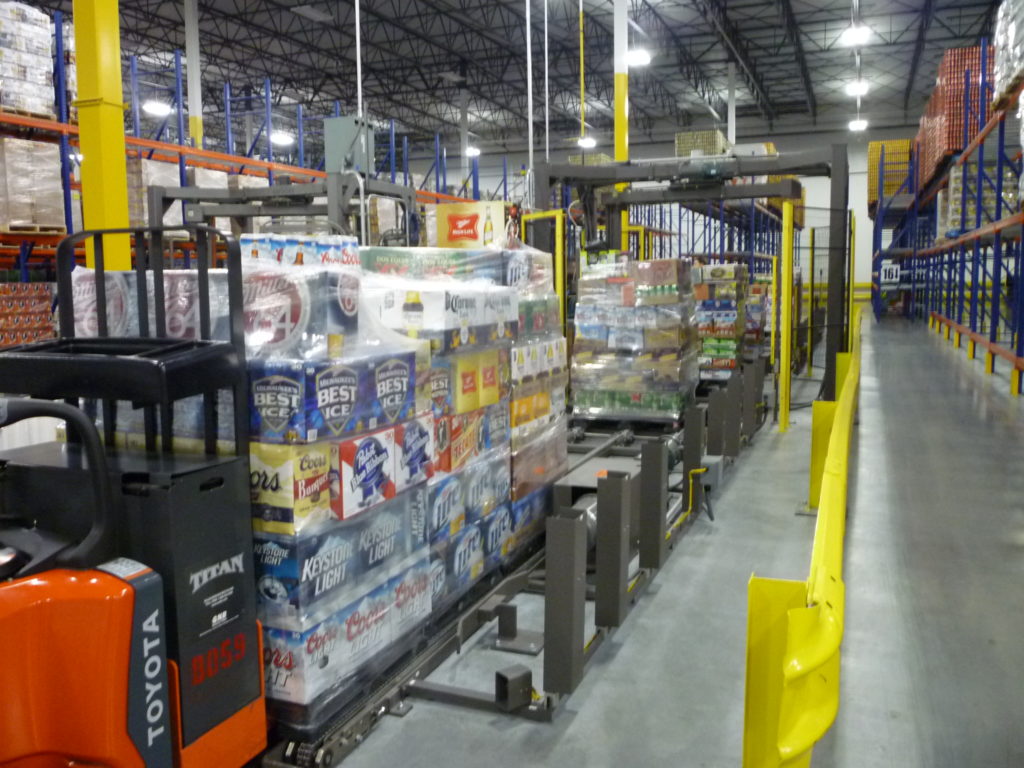
There are two types of stretch wrappers shown below. The first allows a triple walkie rider to drop three pallets at a time at the infeed as well as remove 3 pallets at the discharge. The second stretch wrapper allows forklifts to load 1 or 2 pallets at a time on the infeed. The wrapped pallets are removed to staging or loaded directly on the trailer.
Scales can be added to the wrappers to weigh each pallet and compare it to what the pallet should weigh. If the difference exceeds a variance of plus or minus 7 to 9 pounds, the case count is incorrect and the pallet needs to be inspected. This reduces finished goods losses and also improves order accuracy. Cost varies from $65,000 to over $200,000. The ROI is usually less than 3 years depending on the number of pallets that need to be wrapped daily.
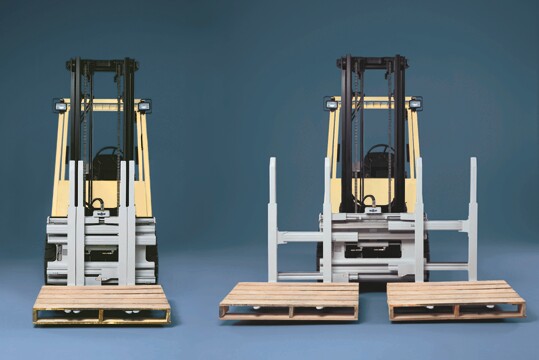
Single/Double Attachment
Single/double attachments for forklifts can decrease truck unloading time by almost 50%. This works best for ABI/MillerCoors pallets and can also be used on 40″ x 48″ pallets if they are in good shape and the receiving doors are wide enough.
Delivery Analysis
Delivery operations provide one of the most lucrative areas to find cost savings. The following areas should be evaluated to determine what potential savings exist in your operation. We have saved some individual distributors in excess of $1,000,000 per year in delivery costs through our in depth analysis.
Cases/Stop Analysis
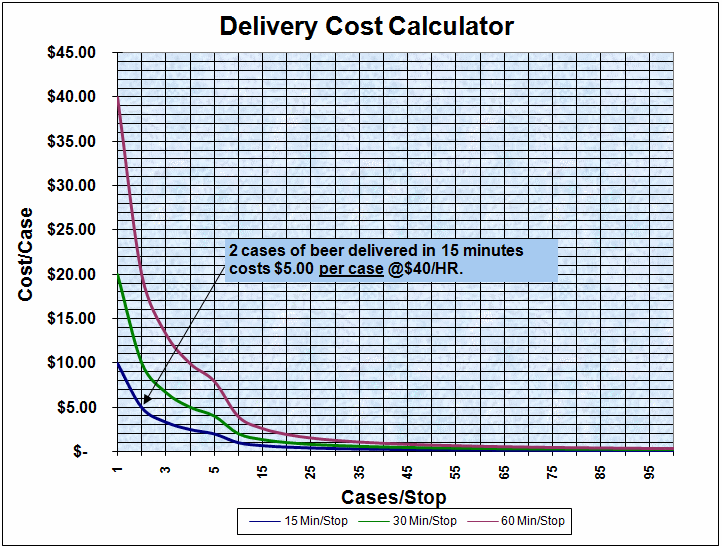
With delivery costs exceeding $40/hour, delivering less than 5 cases/stop can result in significant increase in delivery expense. The chart below shows that 2 cases delivered in 15 minutes including travel time results in a delivery cost of $5/case. One distributor had over 10,000 deliveries per year under 5 cases/stop.
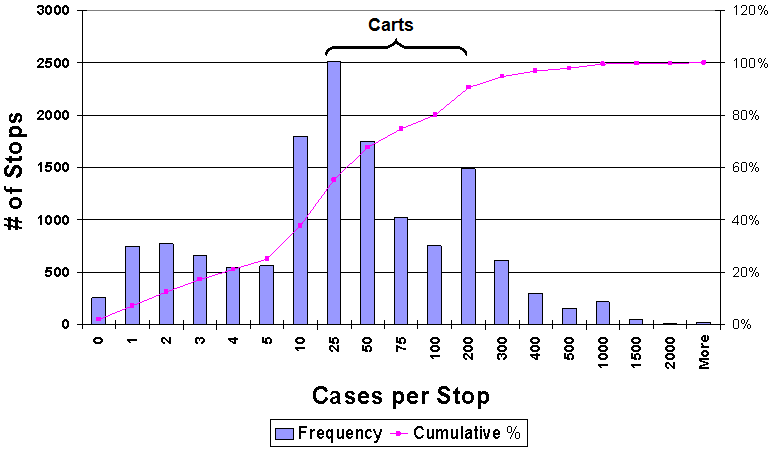
The cases per stop chart shows the number of stops below 5 cases/stop as well as an overview of the total delivery operation. Deliveries that average between 25 and 200 cases/hour are excellent candidates for cart delivery in appropriate markets.
Service Policy Analysis
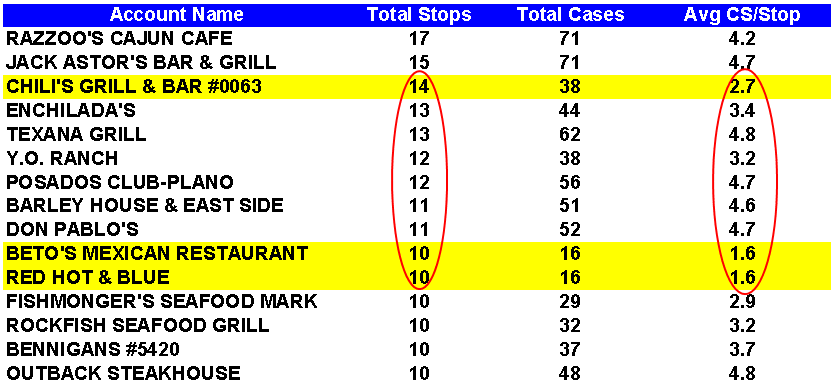
A service policy analysis reveals accounts that are being over serviced as shown below. Reducing the number of times that retail accounts are over serviced can help achieve delivery minimums. The chart below shows one analysis we conducted that solved the minimum cases per stop problem by reducing the number of stops per month to a reasonable number and eliminated several routes in the process.
Daily Delivery Variability
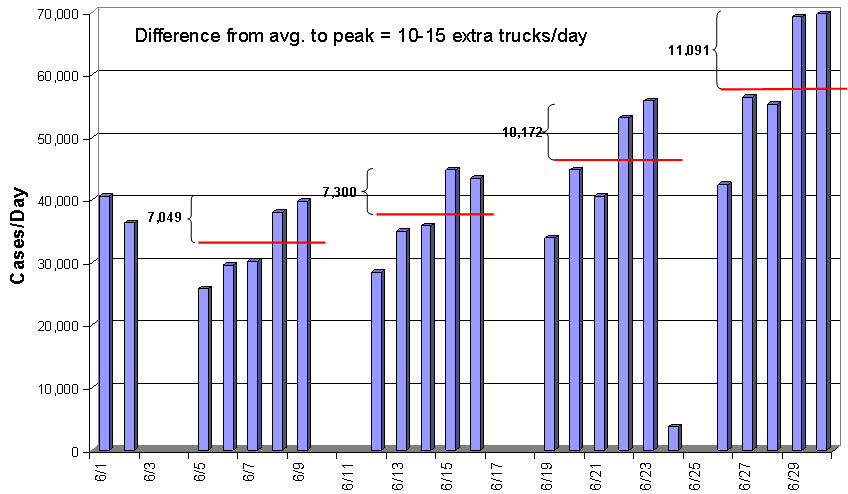
Changing service policy is also an excellent opportunity to level daily deliveries. For one client, we were able to eliminate 11 delivery trucks by reducing the peak days and moving account service to earlier in the week. This also improves warehouse productivity by leveling staffing and eliminating overtime. Going to 4 day a week deliveries can actually increase the number of delivery trucks and warehouse equipment required.
Cart Delivery System
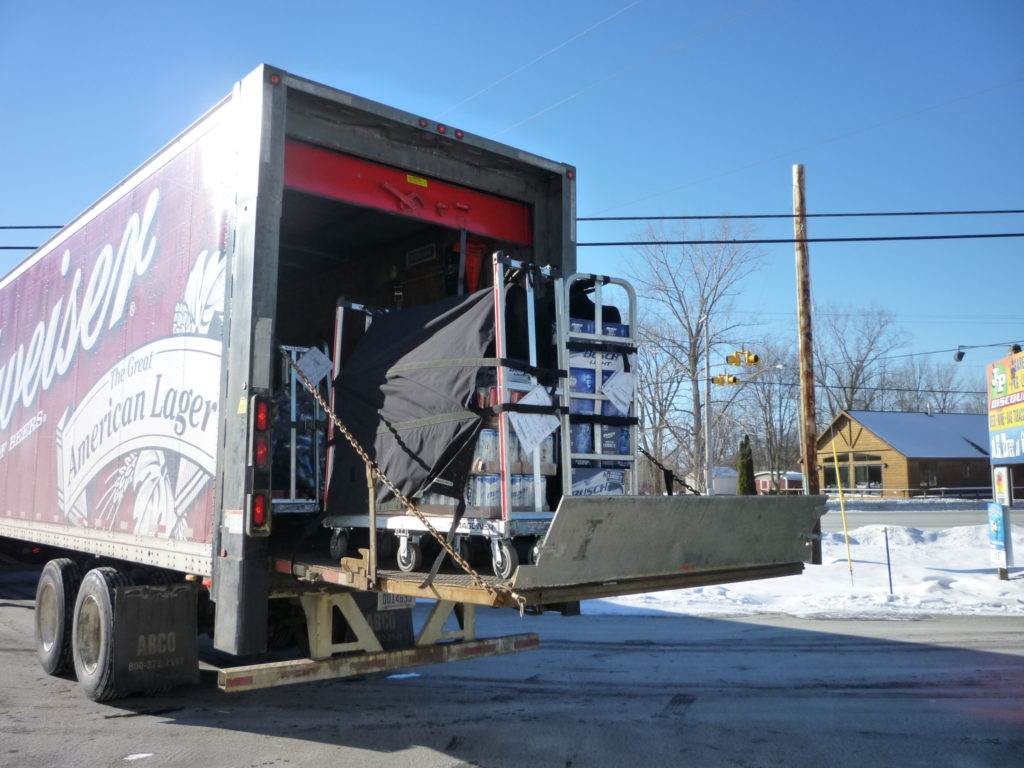
Cart delivery in the right market properly implemented will reduce delivery time by a minimum of 30%. Let us see if your operation can benefit with this delivery technique. In most instances, capital investments payout in less than one year. It has also been quite effective when implemented in snow regions of the country and in deposit/return states.
Pallet delivery systems can be less costly to implement and attractive to consider.
We can conduct a delivery analysis to determine which system would be best for you.
Next Steps…
Give Chet Willey Associates a call at (817) 291-5314 and let us discuss your requirements and provide you with a cost estimate and proposal. You can also click the link below and send us a quick email if you would rather have us contact you.
